SNF Quality Mix and Payer Shift Financial Impact Analysis
Payer mix, not occupancy, determines whether your beds actually generate profit.

Skilled nursing facilities running at very high occupancy can still lose money every month, while a facility running at 80% turns a healthy margin. Payer mix drives the difference: the split between who's paying for each bed day and what that payer actually pays. Census tells you how full the building is. Payer mix tells you whether the building makes money, and understanding how that mix shifts under Medicare Advantage growth, PDPM code changes, and Medicaid rate stagnation is now the central financial skill for SNF operators and the advisors who work with them.
Why payer mix, not census, drives SNF financial outcomes
Fill the beds. That is the operator's first instinct, and it is not wrong exactly, but it skips past the question that actually determines solvency: whose beds are they, and who is paying for them?
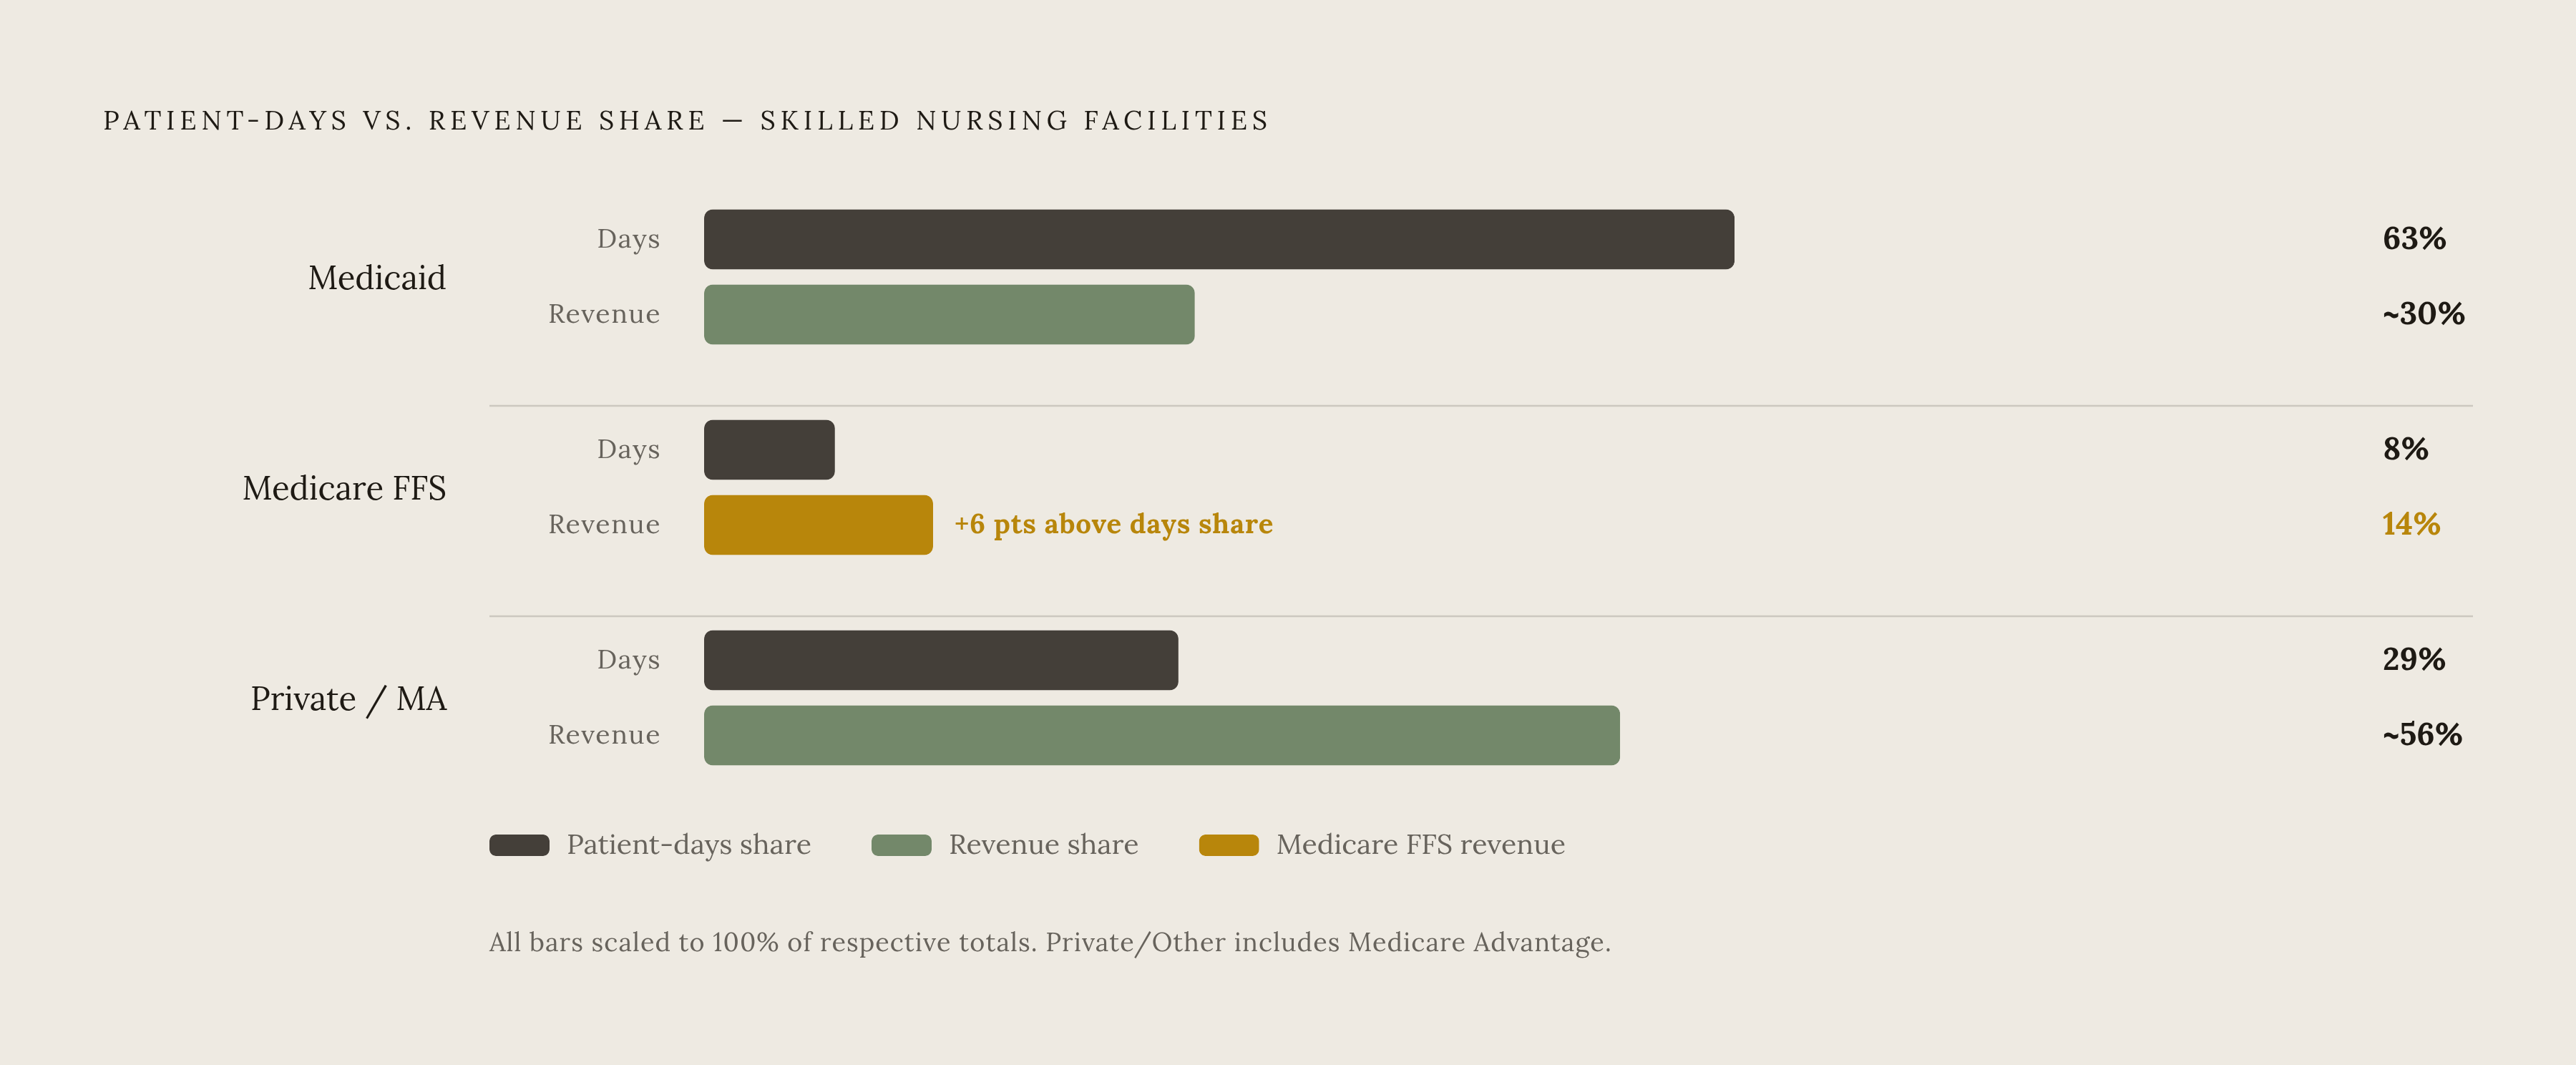
Payer mix is the split of patient days and revenue across Medicare, Medicaid, and private or managed care payers. Two numbers, days and dollars, tell almost opposite stories. Nationally, Medicaid accounts for 63% of patient days, Medicare fee-for-service (FFS) just 8%, and private and other payers, which includes Medicare Advantage, the remaining 29%. Revenue tells the opposite story. Medicare FFS, despite covering only 8% of days, generates 14% of revenue. Medicaid and everything else split the other 86%.
Sit with that gap for a second. An 8% share of days producing 14% of revenue means each Medicare FFS day is worth roughly twice what an average day is worth across the rest of the census. That is the entire financial logic of a skilled nursing facility, compressed into two numbers. A building can run near capacity and still bleed cash if that capacity is stacked with long-stay Medicaid residents who generate volume but not margin. High occupancy with the wrong mix is just a slower version of the same problem as low occupancy, dressed up to look healthier on a census report.
Nearly every facility plays both games at once. About 96% of nursing homes hold dual certification for Medicare and Medicaid, so most operators are simultaneously running a high-volume, low-margin business and a low-volume, high-margin one under a single roof, a single P&L, a single staffing model. That is the reason payer-mix analysis belongs at the start of any read on a SNF's financial health, ahead of the census numbers rather than layered on after them.
Payer Payments and Cost to Serve
Medicare FFS is the anchor, and it is the only payer here that reliably pays above cost. MedPAC put freestanding SNFs' margin on FFS Medicare at 22% in 2023, down slightly from 23% the year before. The more useful number for an operator with open beds is marginal profit, which measures whether taking on one more Medicare patient is actually worth it, and that figure ran a strong 31% for freestanding facilities in 2023.
Medicaid is the largest single funder of long-term care in the country, and it frequently pays below the actual cost of delivering that care. Facilities carrying a heavy long-stay census absorb losses caused by that gap, and In some states, Medicaid rates have lagged for years while wages and every other operating cost kept climbing. Facilities keep that census anyway, because it is the volume base that covers fixed costs while Medicare margin does the actual work of keeping the facility profitable.
Medicare Advantage does not fit either mold, and treating it like ordinary private-pay revenue is the mistake that quietly wrecks a lot of payer-mix analysis. MA rates are negotiated plan by plan, unlike FFS rates, which are set by statute, and they vary widely depending on the contract. The rate is only half the story, though. MA comes bundled with utilization management and prior-authorization requirements that can constrain how care is delivered and reimbursed. Because MA sits buried inside that 29% "private/other" bucket in national data, and inside the 86% revenue bucket alongside Medicaid, an operator scanning top-line numbers can miss how much MA is dragging on effective margin. From a distance, it looks like ordinary revenue. Up close, it behaves nothing like FFS, and mistaking one for the other is how a facility's margin projection quietly comes apart mid-year.
Private pay is the smallest piece by volume but carries the highest per-day rate. It rarely earns its own line in aggregate industry data, but at the facility level, particularly in markets with strong private-pay demand, it can separate a thin margin from a real one.
The Medicare Advantage enrollment shift's effect on quality mix revenue
MA enrollment has continued to grow, adding beneficiaries at a meaningful pace in recent years. Recent data suggest that growth ran slower than in prior years, and projections suggest MA will account for a substantial majority of all Medicare beneficiaries within the coming decade. This is the shape of the program going forward, and it is the trajectory operators need to plan around for the long haul.
Who controls those enrollees shapes plan relationships and negotiating leverage across the market. A small number of large national insurers dominate the MA market, and that concentration means a handful of plan relationships set the authorization and payment terms for a large share of the post-acute population moving through SNFs. That concentration means a small number of plan relationships set the authorization terms, and the payment terms, for a large share of the post-acute population moving through SNFs.
Special Needs Plans complicate things further. A significant share of MA enrollees sits in an SNP, and a large portion of that SNP population is enrolled in Dual Eligible SNPs (D-SNPs), covering exactly the Medicaid and Medicare overlap population SNFs have always served. Chronic Condition SNP enrollment has risen sharply in recent years. Read that number for what it implies: complex, high-acuity patients who used to move through FFS Medicare almost by default are increasingly entering care through an MA authorization instead.
Follow that logic through. As more post-acute patients arrive via MA rather than FFS, SNFs lose FFS days, the exact 8% slice of the census generating that disproportionate 14% of revenue, without necessarily picking up equivalent revenue from the MA days replacing them. Margin can quietly erode while census holds perfectly steady, because FFS days get replaced by MA days that generate less revenue per day, and the occupancy figure alone will not flag it. The top-line number stays green because FFS days get replaced by MA days that generate less revenue per day, and the occupancy figure alone will not flag it, so the P&L goes quietly red even as census holds steady.
The FY 2026 Medicare rate update's interaction with payer-mix math
CMS finalized a 3.2% net rate increase for FY 2026, up from the 2.8% initially proposed, effective October 1, 2025. The math behind it includes a 3.3% market basket increase, a 0.6% forecast error adjustment, and a -0.7% productivity adjustment. CMS estimates this adds roughly $1.16 billion to Medicare payments to SNFs over the fiscal year.
Set against recent history, in which the prior two years brought increases of 4.0% and 4.2%, 3.2% looks thinner than it sounds. The prior two years brought increases of 4.0% and 4.2%. This is a step down, and it lands at a moment when cost-per-day growth (3.8% in 2023) already outpaced FFS payment-per-day growth (just 2.4%). The rate increase does not keep pace with the cost increase, and that gap does not close on its own. It compounds, year over year, quietly widening the space between what a Medicare day earns and what it costs to deliver.
There is also a number tucked inside the number. Value-Based Purchasing reductions are projected at $208.36 million for FY 2026, and any facility underperforming on the relevant quality metrics can see its rate increase partially, or entirely, wiped out by that VBP penalty.
The real disruption for payer-mix analysis, though, is the PDPM coding change. CMS finalized a set of changes to the ICD-10 code mappings used to assign primary diagnoses under PDPM. Type 1 diabetes, obesity, anorexia, bulimia, and hypoglycemia are all being removed from primary diagnosis eligibility, codes CMS has moved to "Return to Provider" status, removing them from primary diagnosis eligibility. Any facility that has been capturing Medicare days under those codes should expect reclassification, or outright denial, of those stays going forward. The window of days that qualify for full PDPM rates just got narrower, and that narrowing hits hardest at facilities that never rebuilt their coding practices after PDPM's original rollout.
That risk is not hypothetical. Research into PDPM's early years found that 60% of SNFs altered their admission practices in response to the payment model's incentives once it took effect, coding to the reimbursement structure rather than the reverse. If facilities adjusted admission and coding behavior once already under PDPM, the FY 2026 remapping hands them fresh reason, and fresh coding risk, to do it again.
Quality reporting compliance as a direct payer-mix revenue variable
Quality metrics are not a side conversation from payer mix. They determine how much of the quoted Medicare rate a facility actually collects, and that changes the real margin on every single Medicare day in the building.
CMS is rolling out a new MDS validation audit program starting fall 2025, run by Healthcare Management Solutions, LLC (HMS). Beginning in FY 2026, a substantial number of SNFs will be randomly selected and required to submit medical chart documentation validating MDS assessment records. Non-compliance triggers a 2% cut to the following fiscal year's Annual Payment Update.
Quality Reporting Program penalties stack up separately from that audit exposure. Layered on top of the payer-driven erosion of FFS days already underway, a facility can end up losing Medicare volume to MA enrollment growth while simultaneously taking a rate penalty on whatever FFS revenue remains. Two pressures, one direction, one fiscal year.
The OIG is not idle either. Multiple active workplans target nursing homes, with scrutiny covering both financial and clinical dimensions of Medicare billing. A payer-mix spreadsheet does not capture this directly, but it shapes the compliance risk tied to every dollar of Medicare revenue a facility books.
Workforce cost as a hidden payer-mix multiplier on the expense side
Payer mix is not purely a revenue-side story. Staffing costs multiply its effect on the expense side, often invisibly, and most payer-mix conversations leave this out.
The supply of nursing home beds has been shrinking. More than 770 nursing homes closed between February 2020 and July 2024, and the number of freestanding SNFs fell by roughly 1% in 2024 alone. Occupancy climbed to 84% nationally by October 2024, which sounds like good revenue news, but near-capacity operation leaves almost no room to optimize case mix. There is no slack to selectively admit higher-margin patients when every bed is already spoken for.
The staffing shortage makes that worse, not better. Workforce shortages have led a meaningful share of facilities to limit new admissions outright. That is a direct payer-mix constraint: a facility cannot balance its Medicaid census with higher-margin Medicare or MA admissions if it does not have the staff to safely accept them. The bed sits empty. The nurse who could fill it does not exist on the schedule.
Agency labor tightens the math further. Contract RN agency rates kept climbing through 2026, and the spread between what a facility pays the agency and what the nurse actually takes home grew wider, hitting independent and nonprofit operators hardest, since they carry the least pricing flexibility to absorb it. That same gap, driving the Medicaid shortfall discussed earlier, appears on the expense side of the ledger instead of the revenue side.
Turnover data adds another layer: overall staff turnover runs close between urban and rural facilities, 47% versus 46%, not a meaningful gap, while RN-specific turnover splits wider, 43% in urban facilities versus 40% in rural ones. Overall staff turnover runs close between urban and rural facilities, 47% versus 46%, not a meaningful gap. RN-specific turnover splits wider though: 43% in urban facilities versus 40% in rural ones. RN staffing hours feed directly into VBP scoring and into federal staffing mandate compliance, both of which loop back into the Medicare rate a facility actually collects. Staffing is not just an expense line. It is a rate multiplier that most cost reports never label as one.
Building a payer-shift impact model: the analytical framework SNF operators and advisors use
Start with the baseline. Pull current census by payer, in days, current revenue by payer, and current cost. The gap between the Medicaid share of days (usually the largest single segment) and the Medicaid share of revenue is the first stress indicator to track, because the underfunding is visible in that gap in real numbers.
From there, map the shift vectors actually bearing on the facility. Which MA plans dominate the local referral network, and what is the average authorized length of stay under those specific contracts compared to FFS? Is the current state Medicaid rate above or below the real cost per Medicaid day, and what do state budget signals suggest heading into the anticipated Q4 2026 impact of federal Medicaid cuts? Which primary diagnosis codes currently populating the Medicare census got caught in the FY 2026 ICD-10 remapping, and how many days of revenue does that put at risk?
Once those vectors are mapped, run the marginal math. For each payer scenario, calculate the revenue-per-day shift, then translate a single percentage-point change in Medicare FFS share of total census into a dollar-per-day revenue impact, using the facility's own rate data rather than industry averages. A one-point swing looks small on paper. Multiplied across a full census and a full fiscal year, it rarely stays small, and the facilities that get surprised by their year-end numbers are almost always the ones that skipped this step.
Last step: stress-test the compliance variables against that same model. What happens if a 2% APU reduction from QRP non-compliance, or from a failed MDS validation audit, lands on top of the payer-shift scenario already modeled? That combination, a payer shift already in motion plus a compliance penalty layered on top, is very often the exact scenario that turns a facility with a thin but real margin into one running a loss. Model the payer shift alone and the numbers look survivable. Model it stacked with the compliance penalty, and the same facility looks like it is one bad quarter from a covenant breach.
Financial statement audits and assurance obligations SNF operators must meet
None of the modeling above substitutes for an audit, and treating it as though it does is where some operators get into real trouble with lenders and state regulators alike. A payer-shift model is a planning tool. It tells an operator where the pressure is building. It carries no assurance value on its own, and it will not satisfy a bond covenant, a bank loan agreement, or a state Medicaid cost report attestation that requires audited or reviewed financial statements.
Facilities financed through a government-insured loan program, bond financing, or larger multi-facility credit agreements typically face annual audit requirements as a condition of that financing, independent of whatever internal payer-mix analysis they run. Those audits test the numbers a payer-shift model only estimates: actual revenue recognized by payer, actual bad debt and contractual allowance write-offs, actual cost report reconciliation against what Medicare and Medicaid records show. A model can flag that MA growth is compressing margin. An audit confirms, or contradicts, whether that compression is already visible in the books.
State Medicaid programs add their own layer on top of lender requirements. Most states require an annual cost report, and some require independently audited financials above certain revenue thresholds, tied directly to the Medicaid rate-setting process described earlier in this piece. Get the audit wrong, miss the filing deadline, or file a report that does not reconcile to underlying financials, and the state can adjust, delay, or claw back Medicaid rate payments, the exact revenue stream the payer-mix model depends on holding steady.
The throughline across every section here comes back to the same point. Payer mix determines margin, MA and PDPM shifts are moving that mix in real time, and quality and staffing compliance determine how much of the resulting revenue a facility actually keeps. Audited financials confirm whether all of that theory holds up against the facility's actual books, and any operator treating the audit as a formality, rather than as the final check on everything modeled above, is missing where the real risk sits.
Sources
- Navigating changes to Medicare skilled nursing facility reimbursement rates | Baker Tilly
- CMS Finalizes FY 2026 Payments for Skilled Nursing Facilities, Increasing Payment Rates and Updating Quality Changes - Applied Policy
- Changes in Patient Medical Complexity After Skilled Nursing Facility Payment Reform: A Qualitative Study - Journal of the American Medical Directors Association
- March 2025 report to the Congress--Chapter 6: Skilled nursing facility services
- Document